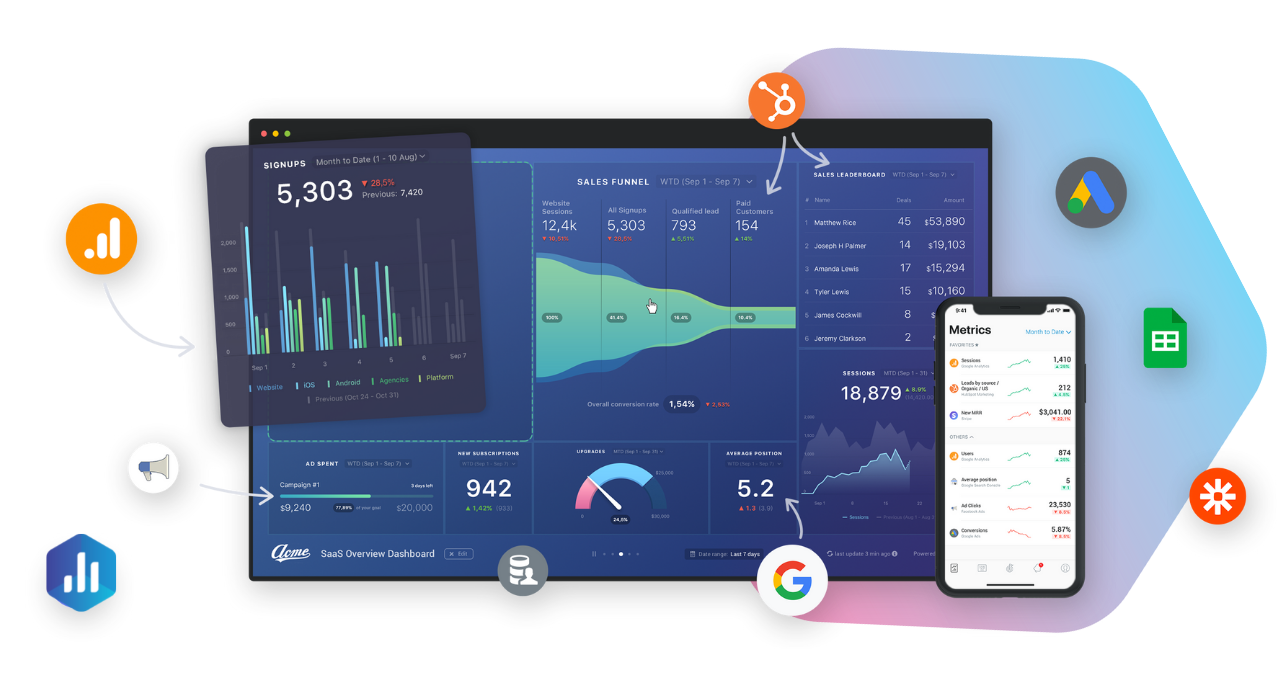
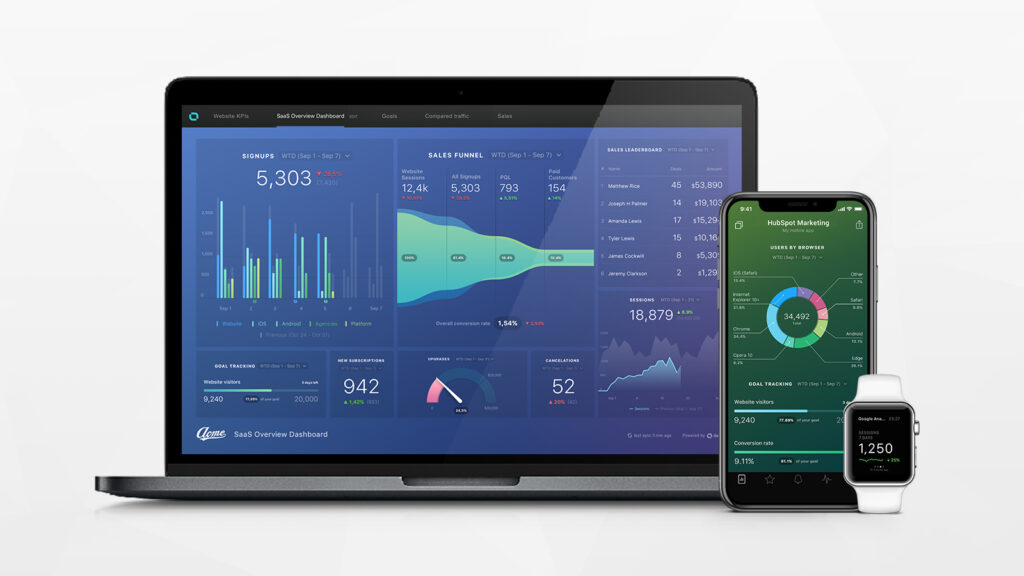
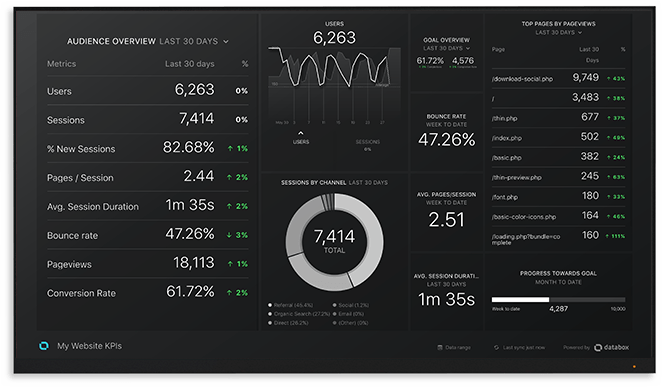
Databox pulls all your data into one place, so you can track performance and discover insights in real-time.
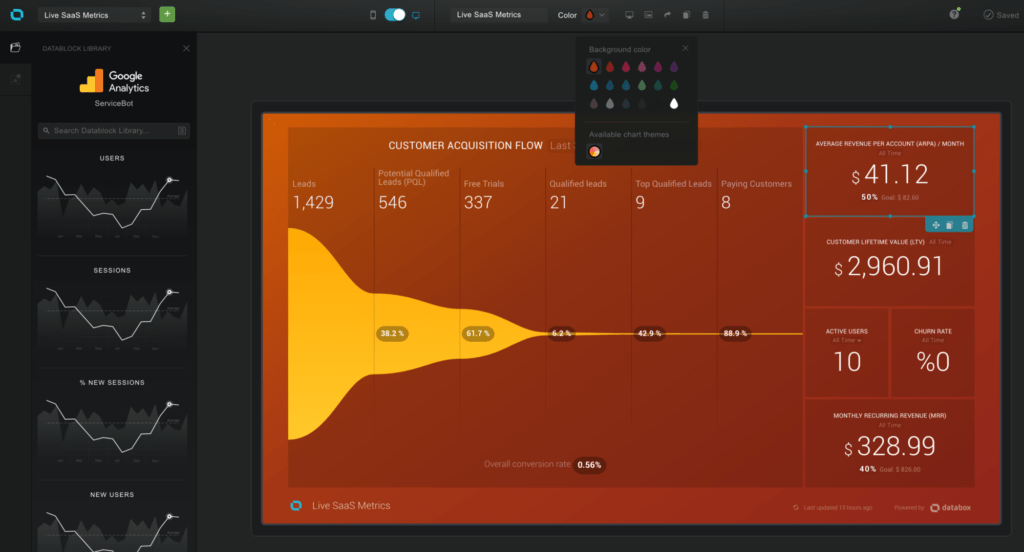
If you’re tired of logging into multiple tools to see how your company is performing then Databox is for you. View all of your performance data in one place so you can spend less time checking and creating reports and more time taking action. Mix and match metrics from different sources in one Databoard and get a more complete view of your performance at a glance.
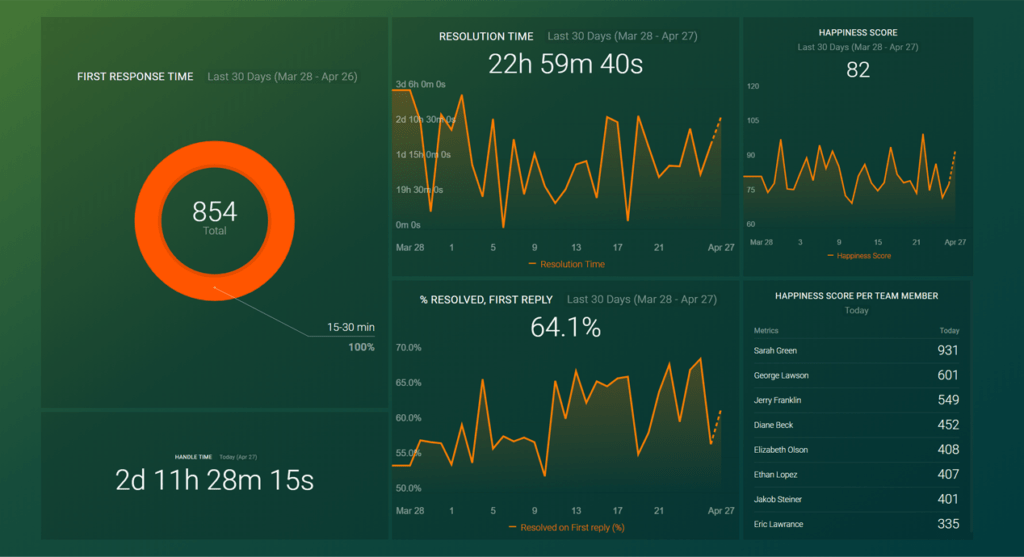
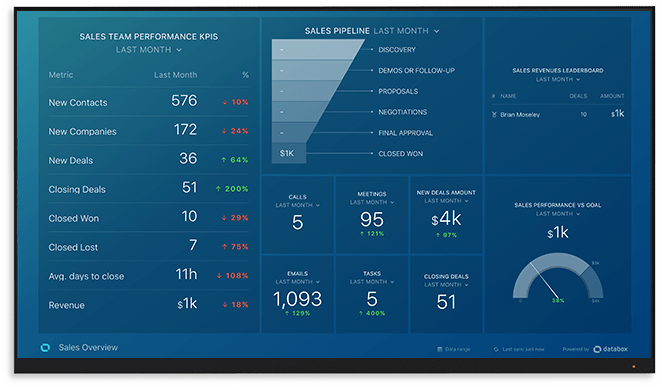
Set goals for specific metrics from over 70 native integrations or any other data you integrate into Databox. Track them all on one screen or visualize your progress toward them on any Databoard. Everyone stays focused on the metrics that matter most.
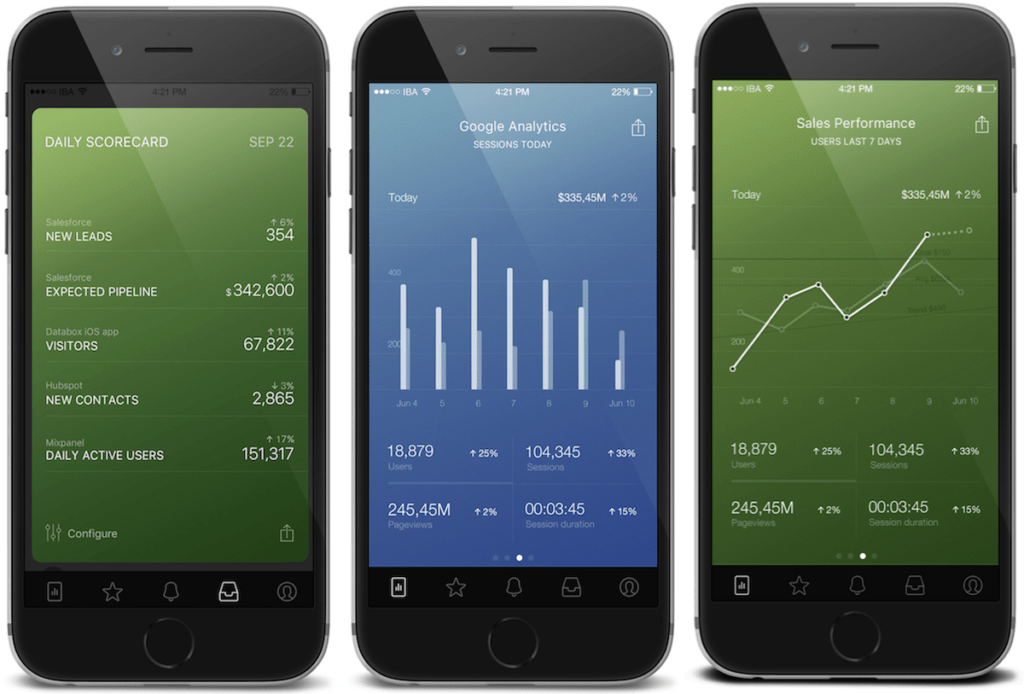
Using Alerts and Insights there’s no need to wait until the end of the month or quarter to know how your performance is trending. With Alerts, get notified when performance is off. With Insights, see a stream of your team’s achievements and receive recommendations for improving your performance.